
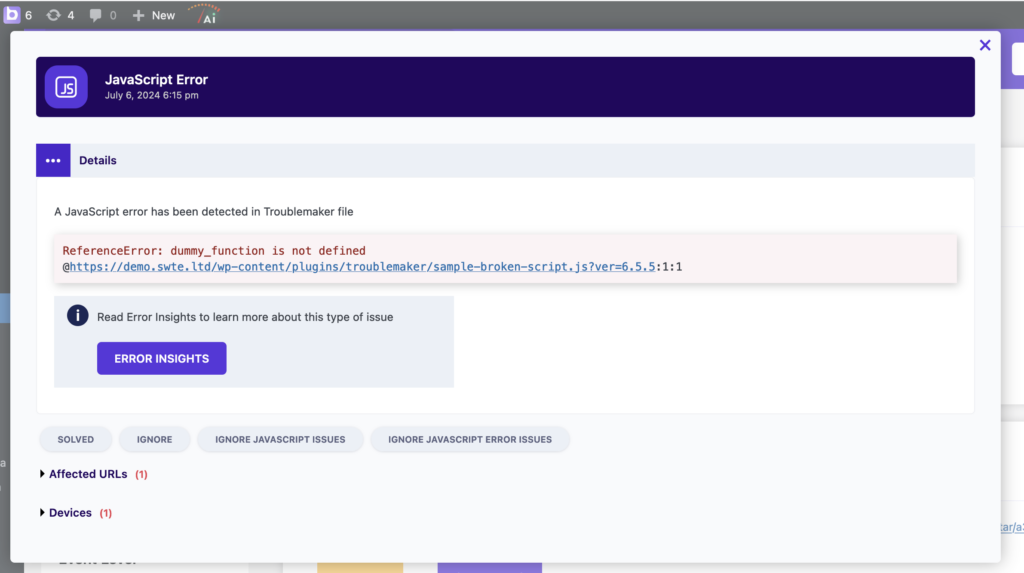
With BugMonitor, your job will be easy because it detects and saves every JavaScript error that occurs on the site. This way, you can view these errors even if they do not appear for you but do for other visitors.
You can view the errors on the BugMonitor interface just as you would see them in the browser console. Moreover, you can also see which plugin, extension, or third-party service the faulty script belongs to.
However, if BugMonitor is not installed, you can use Chrome’s Developer Tools, which provide a robust set of features to help you identify and fix these errors efficiently. Here’s a step-by-step guide to checking JavaScript errors in Chrome:
1. Open Chrome Developer Tools
To start, open the Chrome browser and navigate to the web page you want to debug. Then, follow one of these methods to open Developer Tools:
- Keyboard Shortcut: Press
Ctrl + Shift + I(Windows/Linux) orCmd + Option + I(Mac). - Menu Navigation: Click the three vertical dots in the top-right corner of Chrome, go to “More Tools,” and then select “Developer Tools.”
2. Navigate to the Console Tab
Once Developer Tools is open, click on the “Console” tab. This tab displays all the JavaScript errors, warnings, and other messages logged by the browser.
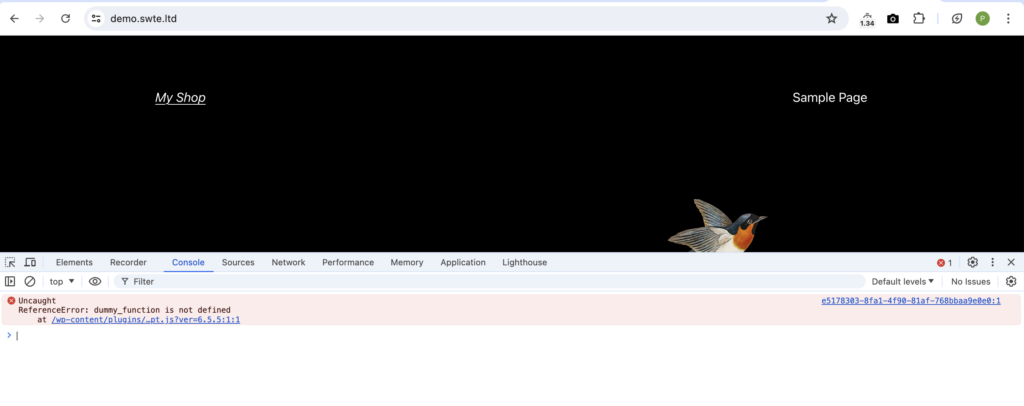
3. Identify JavaScript Errors
JavaScript errors are marked with a red icon. You can see the error message, the file in which it occurred, and the line number. Click on the file name and line number to navigate directly to the source code where the error occurred.
4. Use the Error Details
Clicking on the error message provides more details, including:
- Error Type and Message: Describes what went wrong.
- Call Stack: Shows the function calls that led to the error, helping you trace the issue back to its source.
- Link to Source: Takes you to the exact line in your JavaScript file where the error is located.
5. Set Breakpoints
To debug further, you can set breakpoints in your code:
- Go to the “Sources” tab.
- Navigate to your JavaScript file in the left pane.
- Click on the line number where you want to set a breakpoint. A blue icon will appear, indicating the breakpoint is set.
When you reload the page, execution will pause at the breakpoint, allowing you to inspect variables and step through code line by line.
6. Inspect Variables and Scope
While paused at a breakpoint, hover over variables to see their current values. The “Scope” section on the right shows local and global variables, making it easier to understand the current state of your application.
7. Resume and Step Through Code
Use the controls in the Developer Tools to:
- Resume Script Execution (F8): Continue running the code until the next breakpoint.
- Step Over (F10): Move to the next line of code.
- Step Into (F11): Dive into functions called on the current line.
- Step Out (Shift + F11): Exit the current function.
8. Utilize Console Commands
You can also type JavaScript commands directly into the console to test fixes or inspect objects and variables dynamically. This can be particularly useful for experimenting with quick changes.
Instantly detect and report layout problems, functional issues, JavaScript errors, SEO problems, network- and PHP errors.

